- The Roundup
- Posts
- Riding the Waves: A Bitcoiner’s Guide to Liquidations and Market Moves
Riding the Waves: A Bitcoiner’s Guide to Liquidations and Market Moves
🌊 Master the liquidation heatmap to decode price action and make sharper trading decisions.

Welcome to the Rhino Roundup, your weekly dose of industry news, platform updates, educational content, and fun memes in the world of Bitcoin.

 |  |
Rhino Feature Spotlight 📢
Buy Gift Cards with Bitcoin (and Get Bonus Cash!)
Rhino + Prizeout make it easy to grab gift cards from Amazon 🛒, Adidas 👟, Chipotle 🌯, DoorDash 🚗, and more, using your BTC or USD, right inside the app.
Most cards come with bonus value 💸. Buy, click the email, and start spending!
💥Download the Rhino App Today 👇️
https://apps.apple.com/us/app/rhino-bitcoin/id1564149079

Featured Article
The Bitcoin Liquidation Heatmap uses color gradients to reveal where leveraged positions are most likely to be wiped out.
Lighter areas show clusters of liquidation orders; darker zones mean fewer. At a glance, you can spot key support, resistance, and high-volatility danger zones—giving you an edge before the market moves.
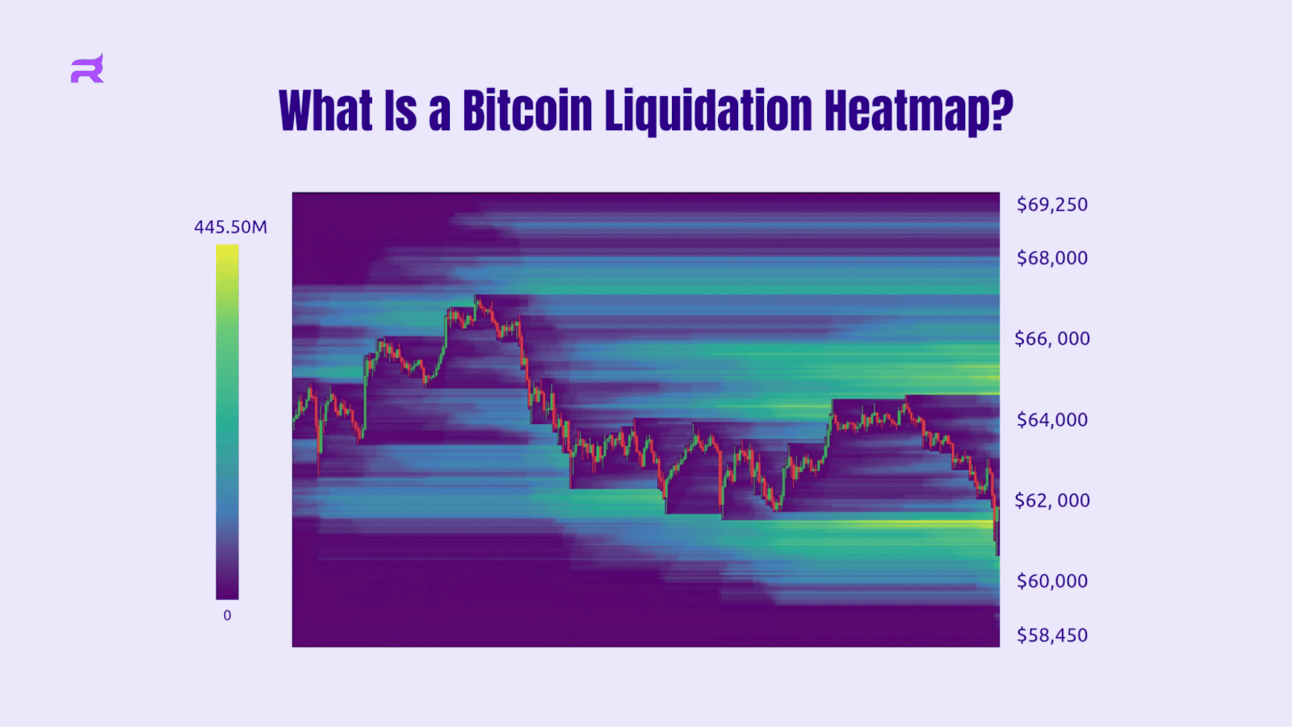
How Does It Work?
The heatmap pulls data from leveraged exchanges, showing where traders could be forced to close their positions. When a trader’s margin drops too low, their position is automatically liquidated, fueling sudden market moves.
By mapping these potential liquidation points, the heatmap gives a snapshot of where volatility could strike next.
For example, if short sellers have liquidation levels at $95,000, a price surge could trigger forced buys, pushing prices higher and setting off a cascade. Spotting these setups helps traders stay ahead and adjust their strategies before the action hits.
Why Do Bitcoiners Use Liquidation Heatmaps?
Active Bitcoiners know the value of tools that reveal market psychology. The Bitcoin Liquidation Heatmap does exactly that, offering a glimpse into the behavior of leveraged traders.
For those stacking sats and using volatility to their advantage, the heatmap highlights price traps and squeeze zones, helping you time entries and exits with greater precision.
Curious about the importance of liquidation heatmaps when trading? Read the full post here to find out more.
Meme of the Week
🦏 Behold the power of deflationary money...
— Rhino Bitcoin App (@RhinoBTCapp)
3:20 PM • Apr 22, 2025
How Did We Do?Give us feedback and earn Bitcoin! |